How to use Smart Reports in easySales: reordering, returns, couriers and the EU OSS threshold

See what to reorder, which products come back, how your couriers deliver and how close you are to the EU OSS threshold, with the ready-made Smart Reports.
What Smart Reports are
Smart Reports answer six everyday questions about your shop: what to reorder, which products come back, how your couriers deliver, how close you are to the EU OSS threshold, which eMAG offers can take orders you cannot fulfil, and which categories have the lowest price addition. Open them from Reports → Business Reports → Smart Reports.
Three things to know first:
- Each report counts its own set of orders. The reorder report uses completed orders only, the return report uses orders with a shipment or a return, and the OSS report leaves out cancelled orders and returns. Their numbers will not match your sales reports, and they are not meant to.
- A report is a saved snapshot. When you open a report computed more than a day ago, easySales computes it again; the old figures stay on screen until the new ones are ready. Refresh computes it again now.
- Exports download straight away, as an Excel file of the figures on screen.
The reports
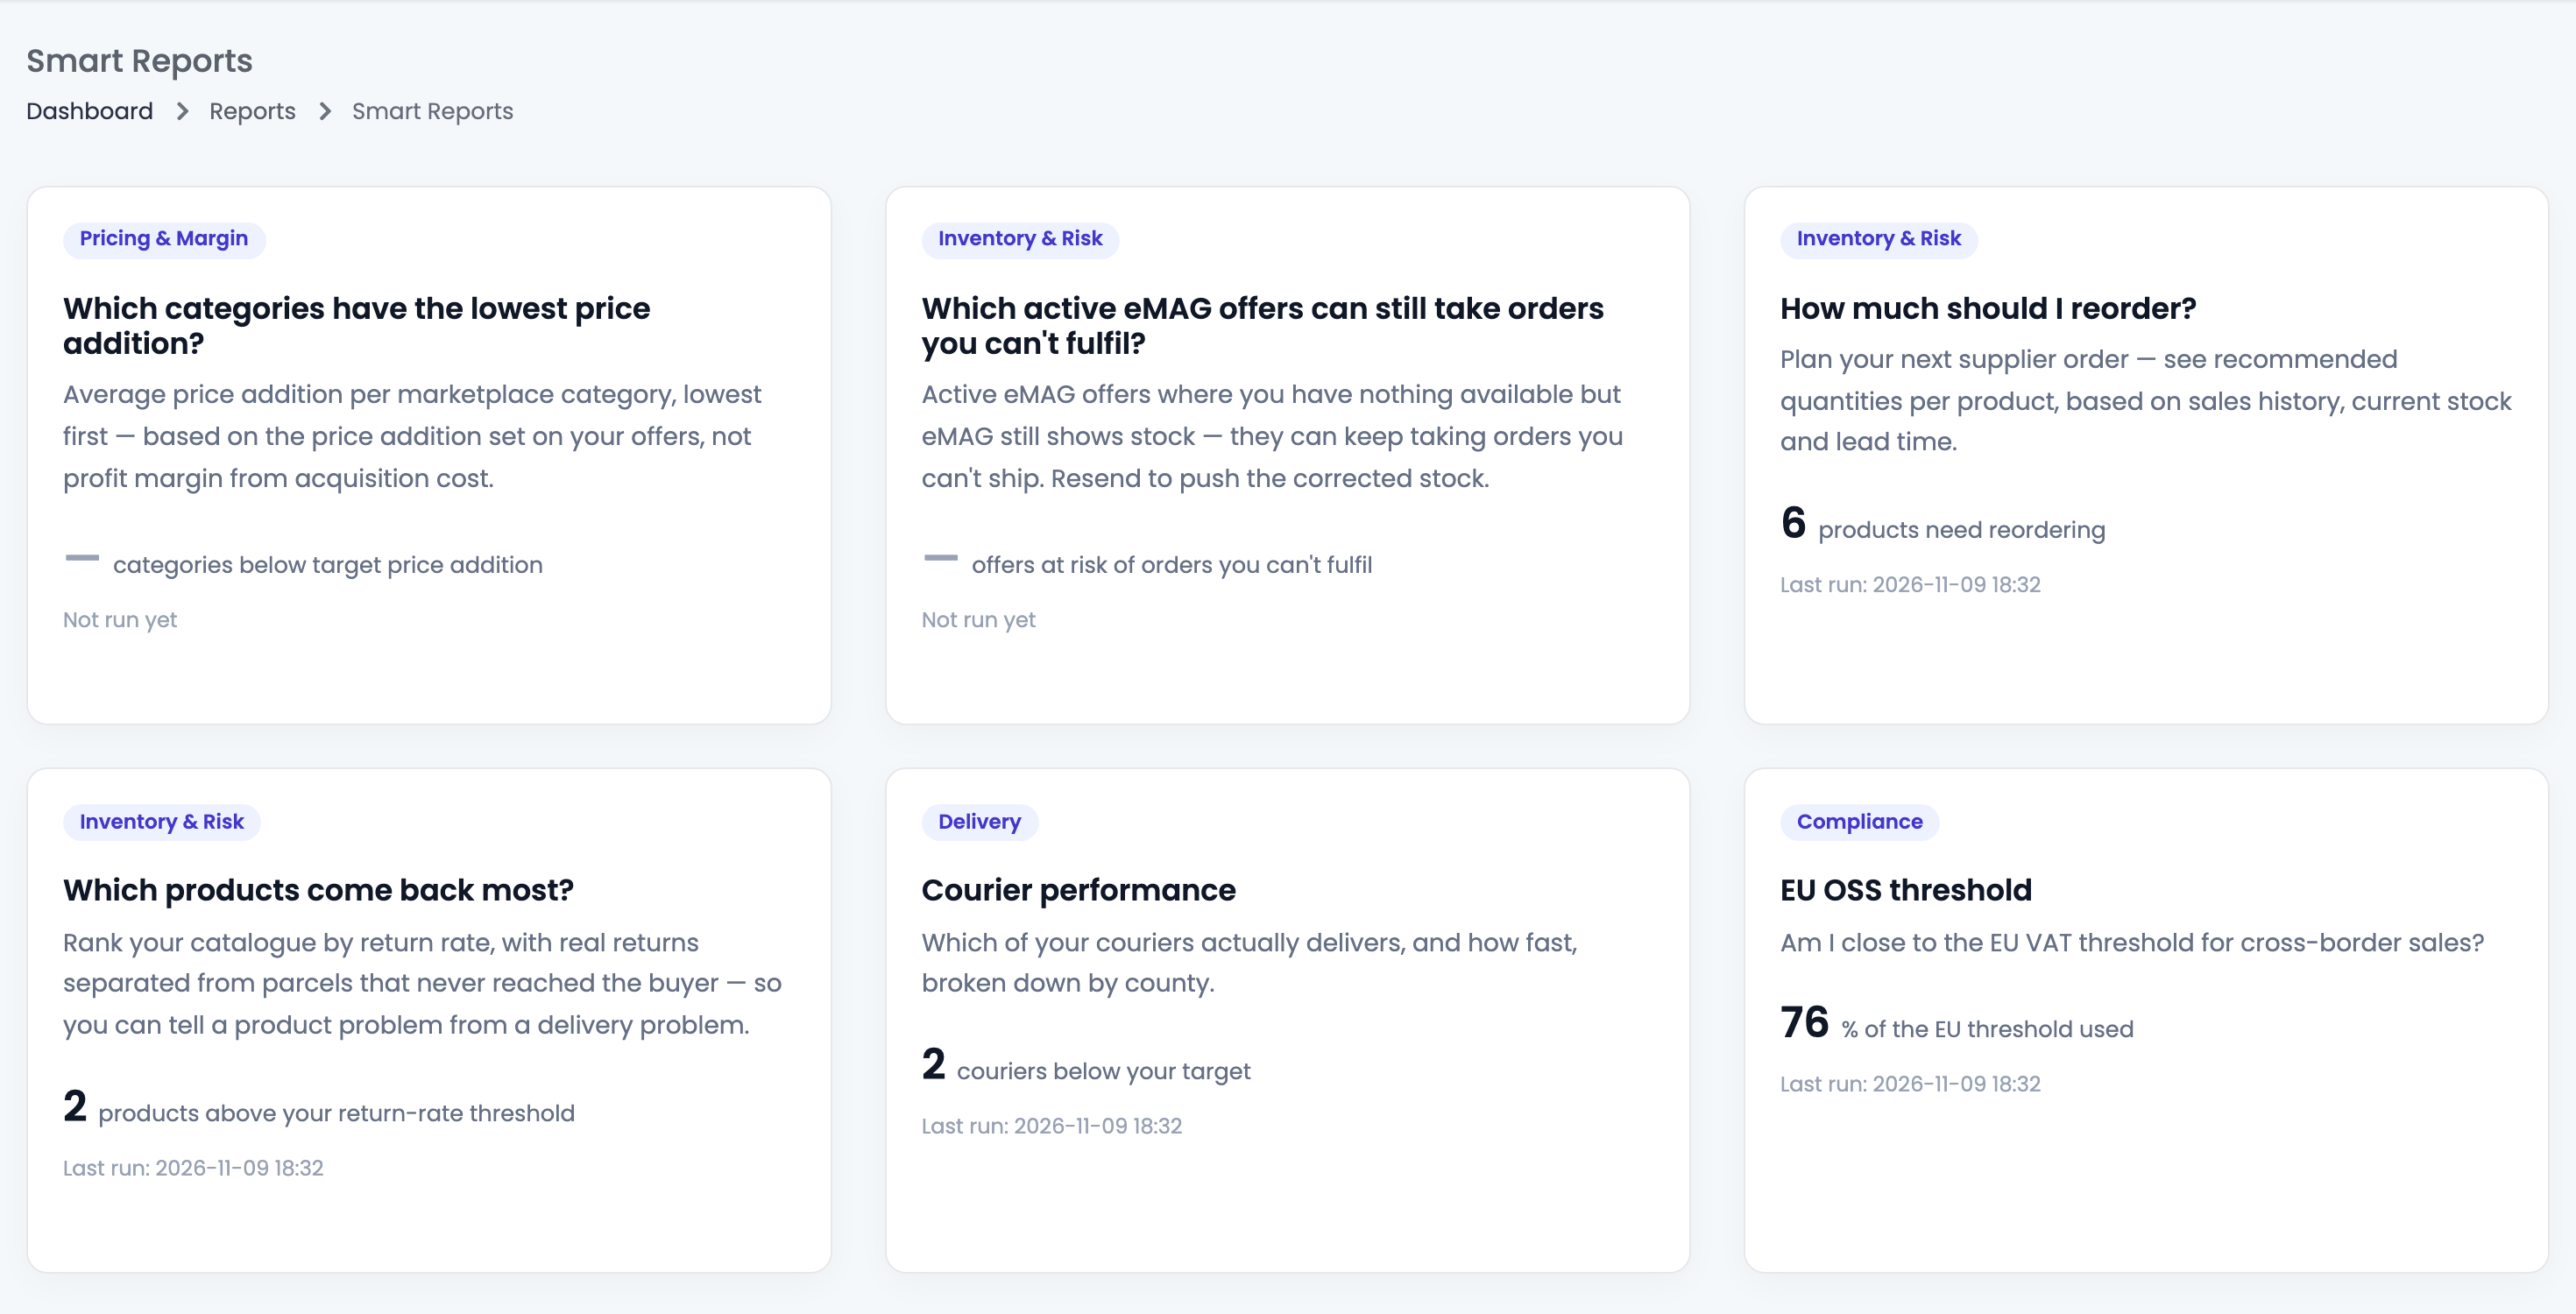
Each card shows the report's main figure and when it was last computed. Open a card to see the report.
| Report | What it answers |
|---|---|
| How much should I reorder? | How many units of each product to order now, from sales, stock and lead time. |
| Which products come back most? | Which products have the most returns and parcels sent back, out of the units sold. |
| Courier performance | Which courier delivers the most parcels, and how fast. |
| EU OSS threshold | How close your EU distance sales are to the threshold this year. |
| Which active eMAG offers can still take orders you can't fulfil? | eMAG offers that still show stock while easySales has none available. |
| Which categories have the lowest price addition? | The average price addition of your offers in each marketplace category. |
On every report, Report settings changes how it is computed and shown, and saves your choice for that report; Reset to default view brings back the defaults. The panel What this report answers explains the columns; Hide explanation closes it.
How much should I reorder?
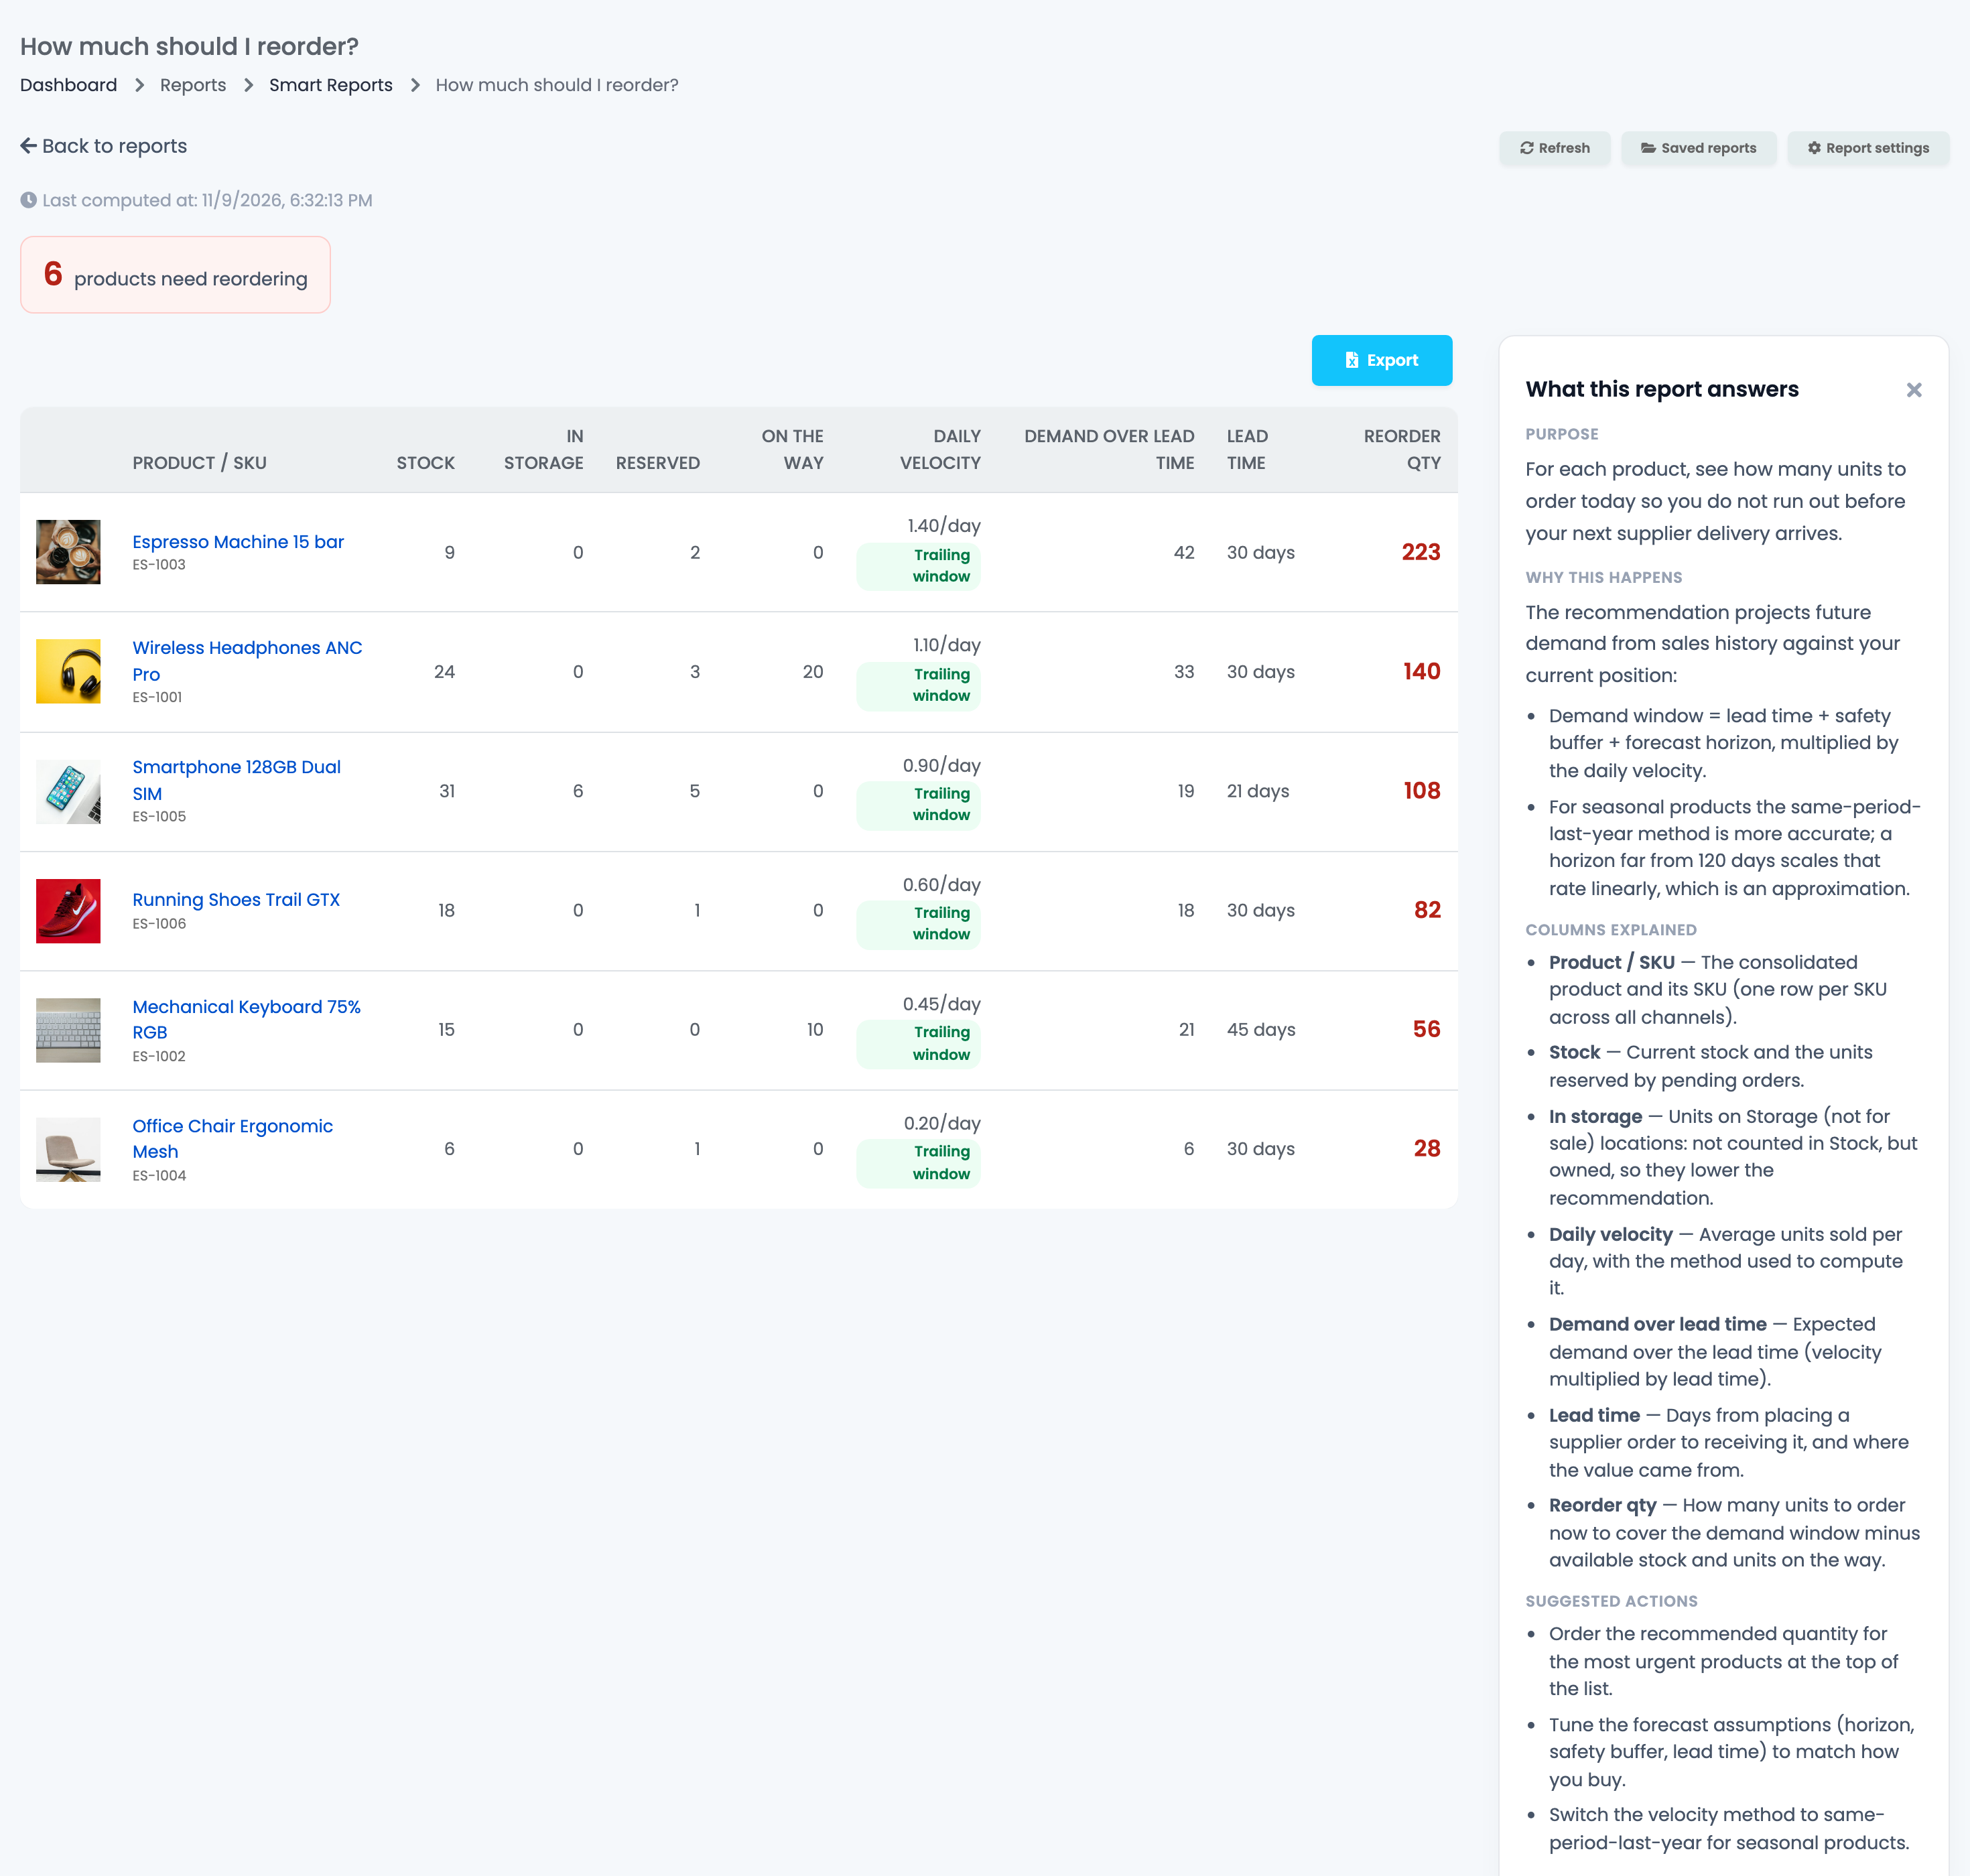
For each product, the report suggests how many units to order now so you do not run out before the next delivery. Sales are counted from completed orders, one row per SKU across all your channels.
- Daily velocity is the average number of units sold per day, measured the way chosen in Velocity method.
- Lead time comes from your most recent supplier order for the product, then from the supplier linked to it, otherwise from Lead-time fallback (days).
- Reorder qty covers the lead time, the Safety buffer (days) and the Forecast horizon (days), minus your available stock, the units In storage and the units On the way from suppliers.
- Demand over lead time shows only the units needed until the delivery arrives.
A product that has never been sold in a completed order is left out unless you tick Include never-sold products in the settings.
Saved reorder reports
Save report keeps a named copy of the list, so you can adjust it before ordering: change a quantity, leave lines out, or put a line back to the calculated quantity. Everyone on your account sees and works on the same saved reports, and you can keep up to 3. Save and re-run calculates the list again and keeps the quantities you entered and the lines you left out. A saved report cannot be exported; export the report itself.
Which products come back most?
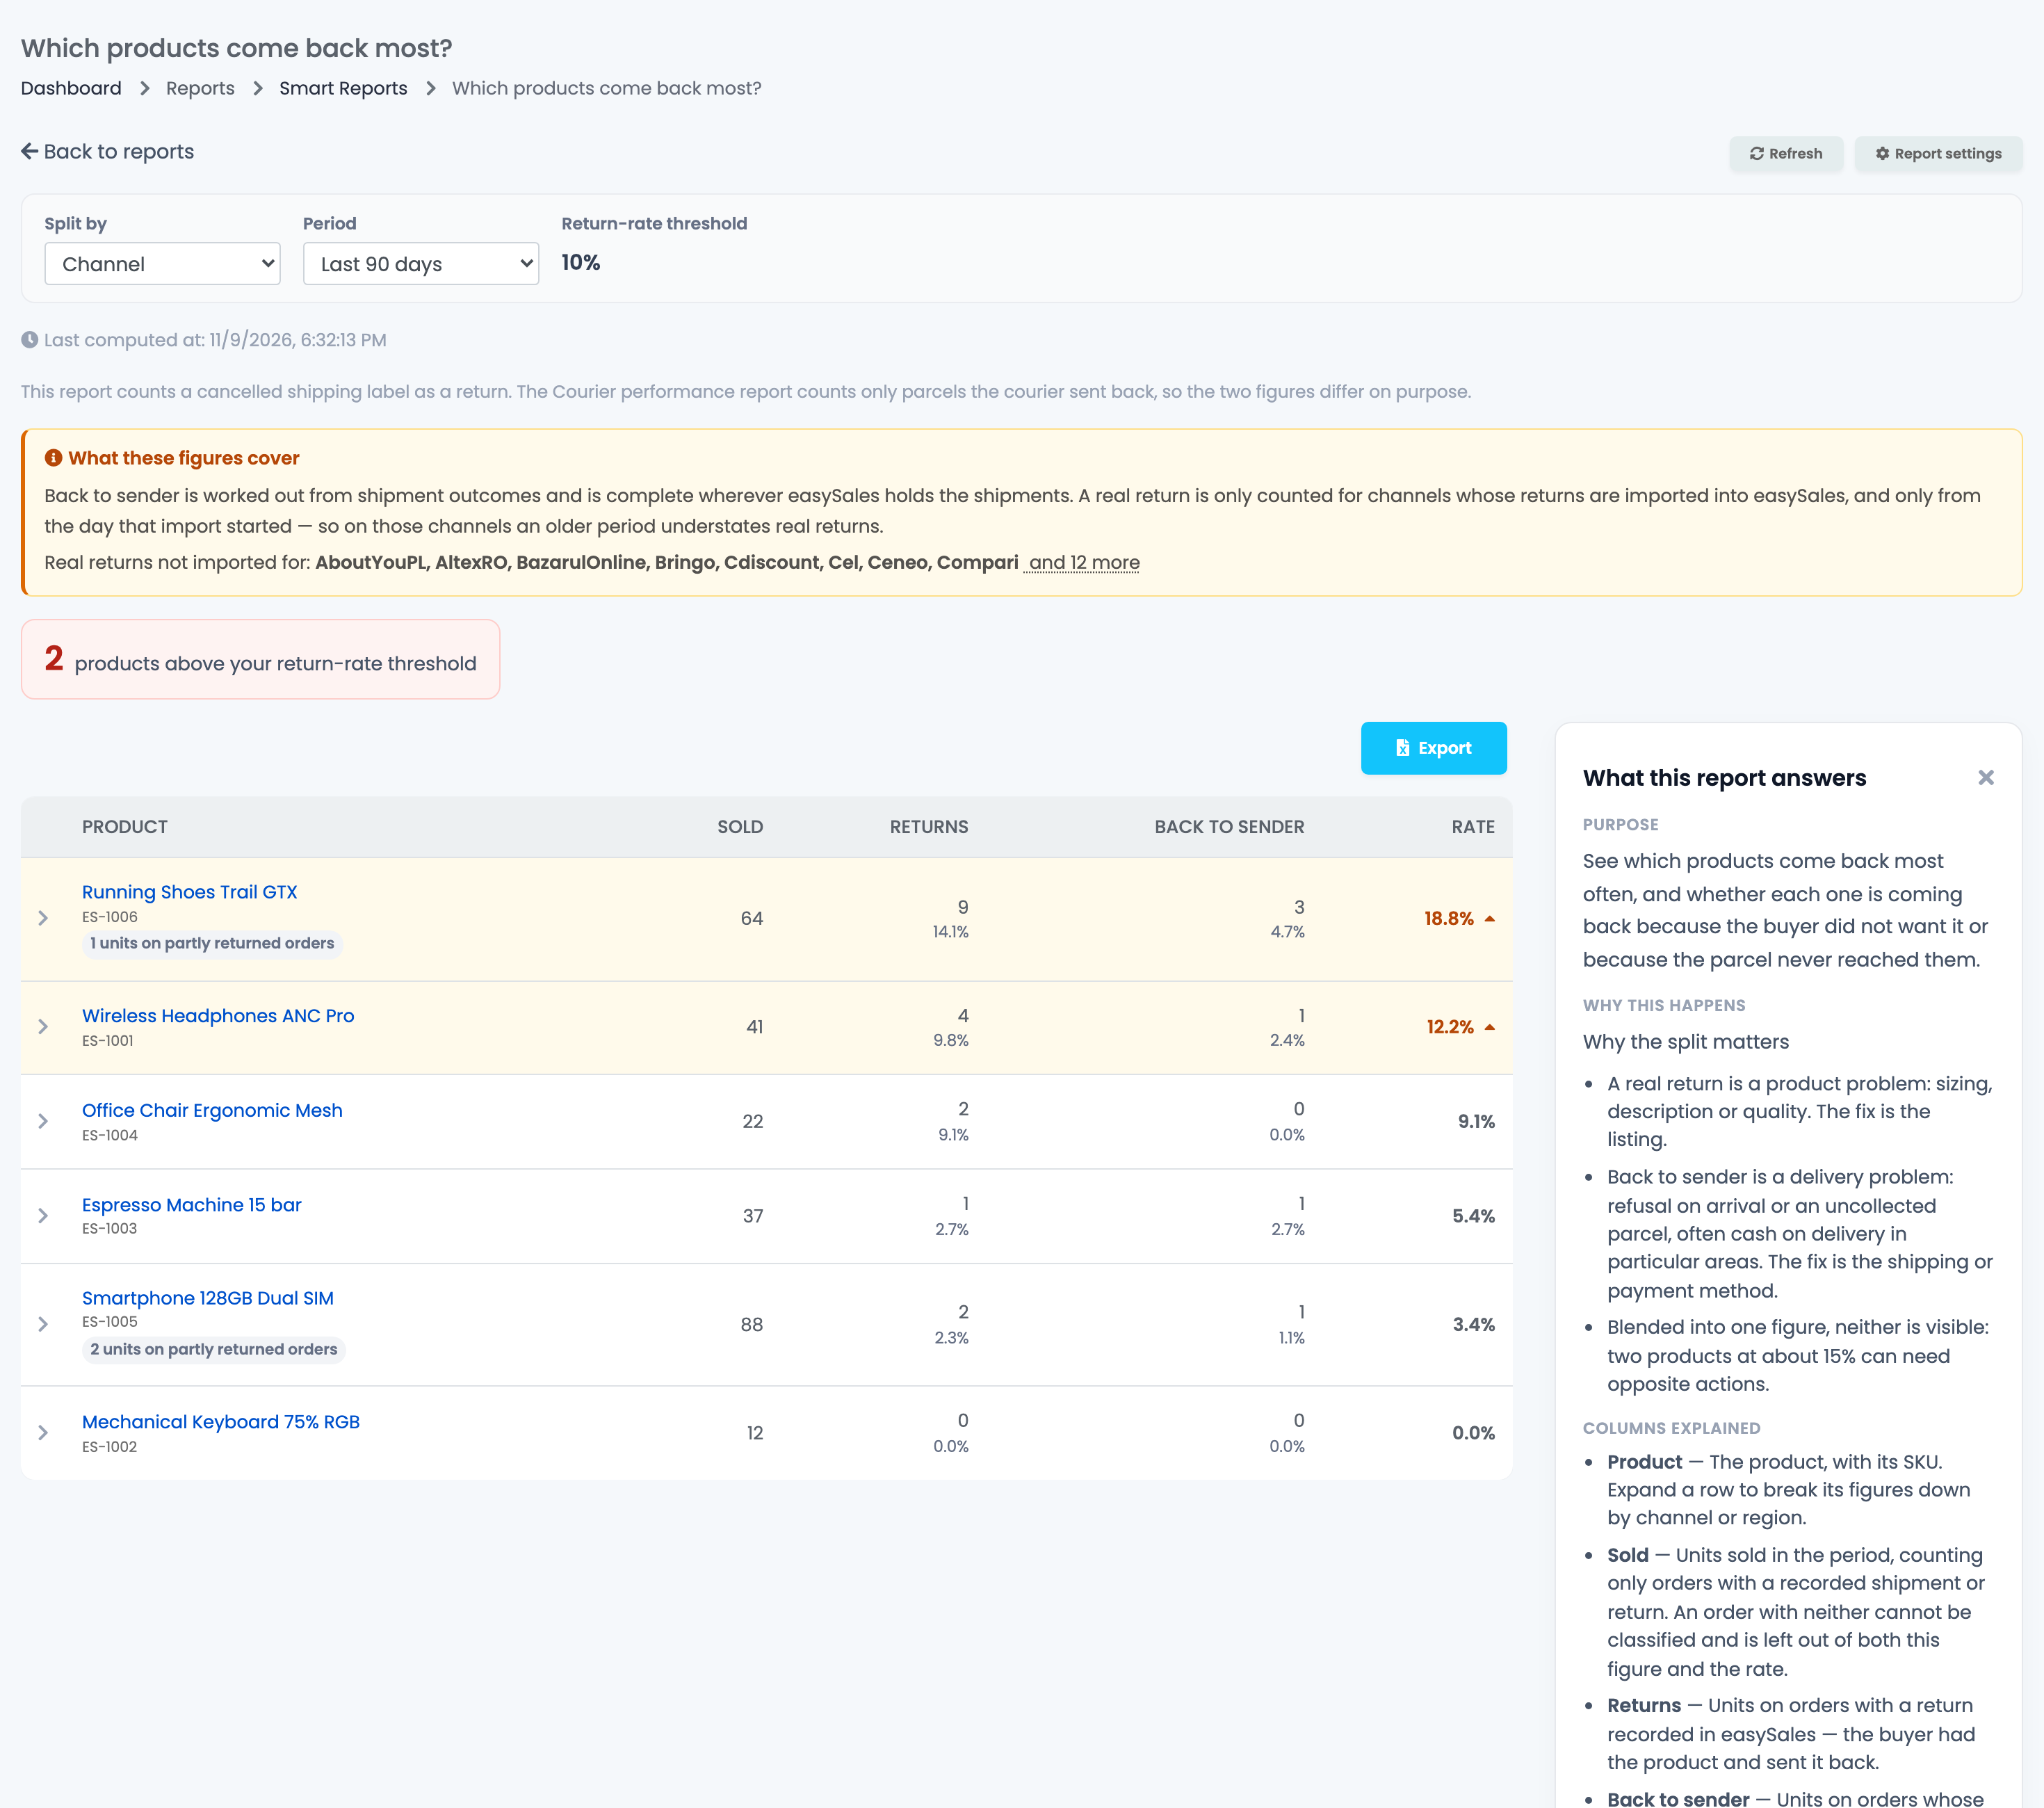
The report ranks your products by how many units came back, out of the units sold in the period, split by Channel or Region.
- Returns are units on orders with a return recorded in easySales: the buyer had the product and sent it back.
- Back to sender are units on orders whose parcels all came back without being delivered. A cancelled AWB also counts here.
- Only orders with a shipment or a return are counted. A product is flagged above your Return-rate threshold only from 10 units sold.
Courier performance
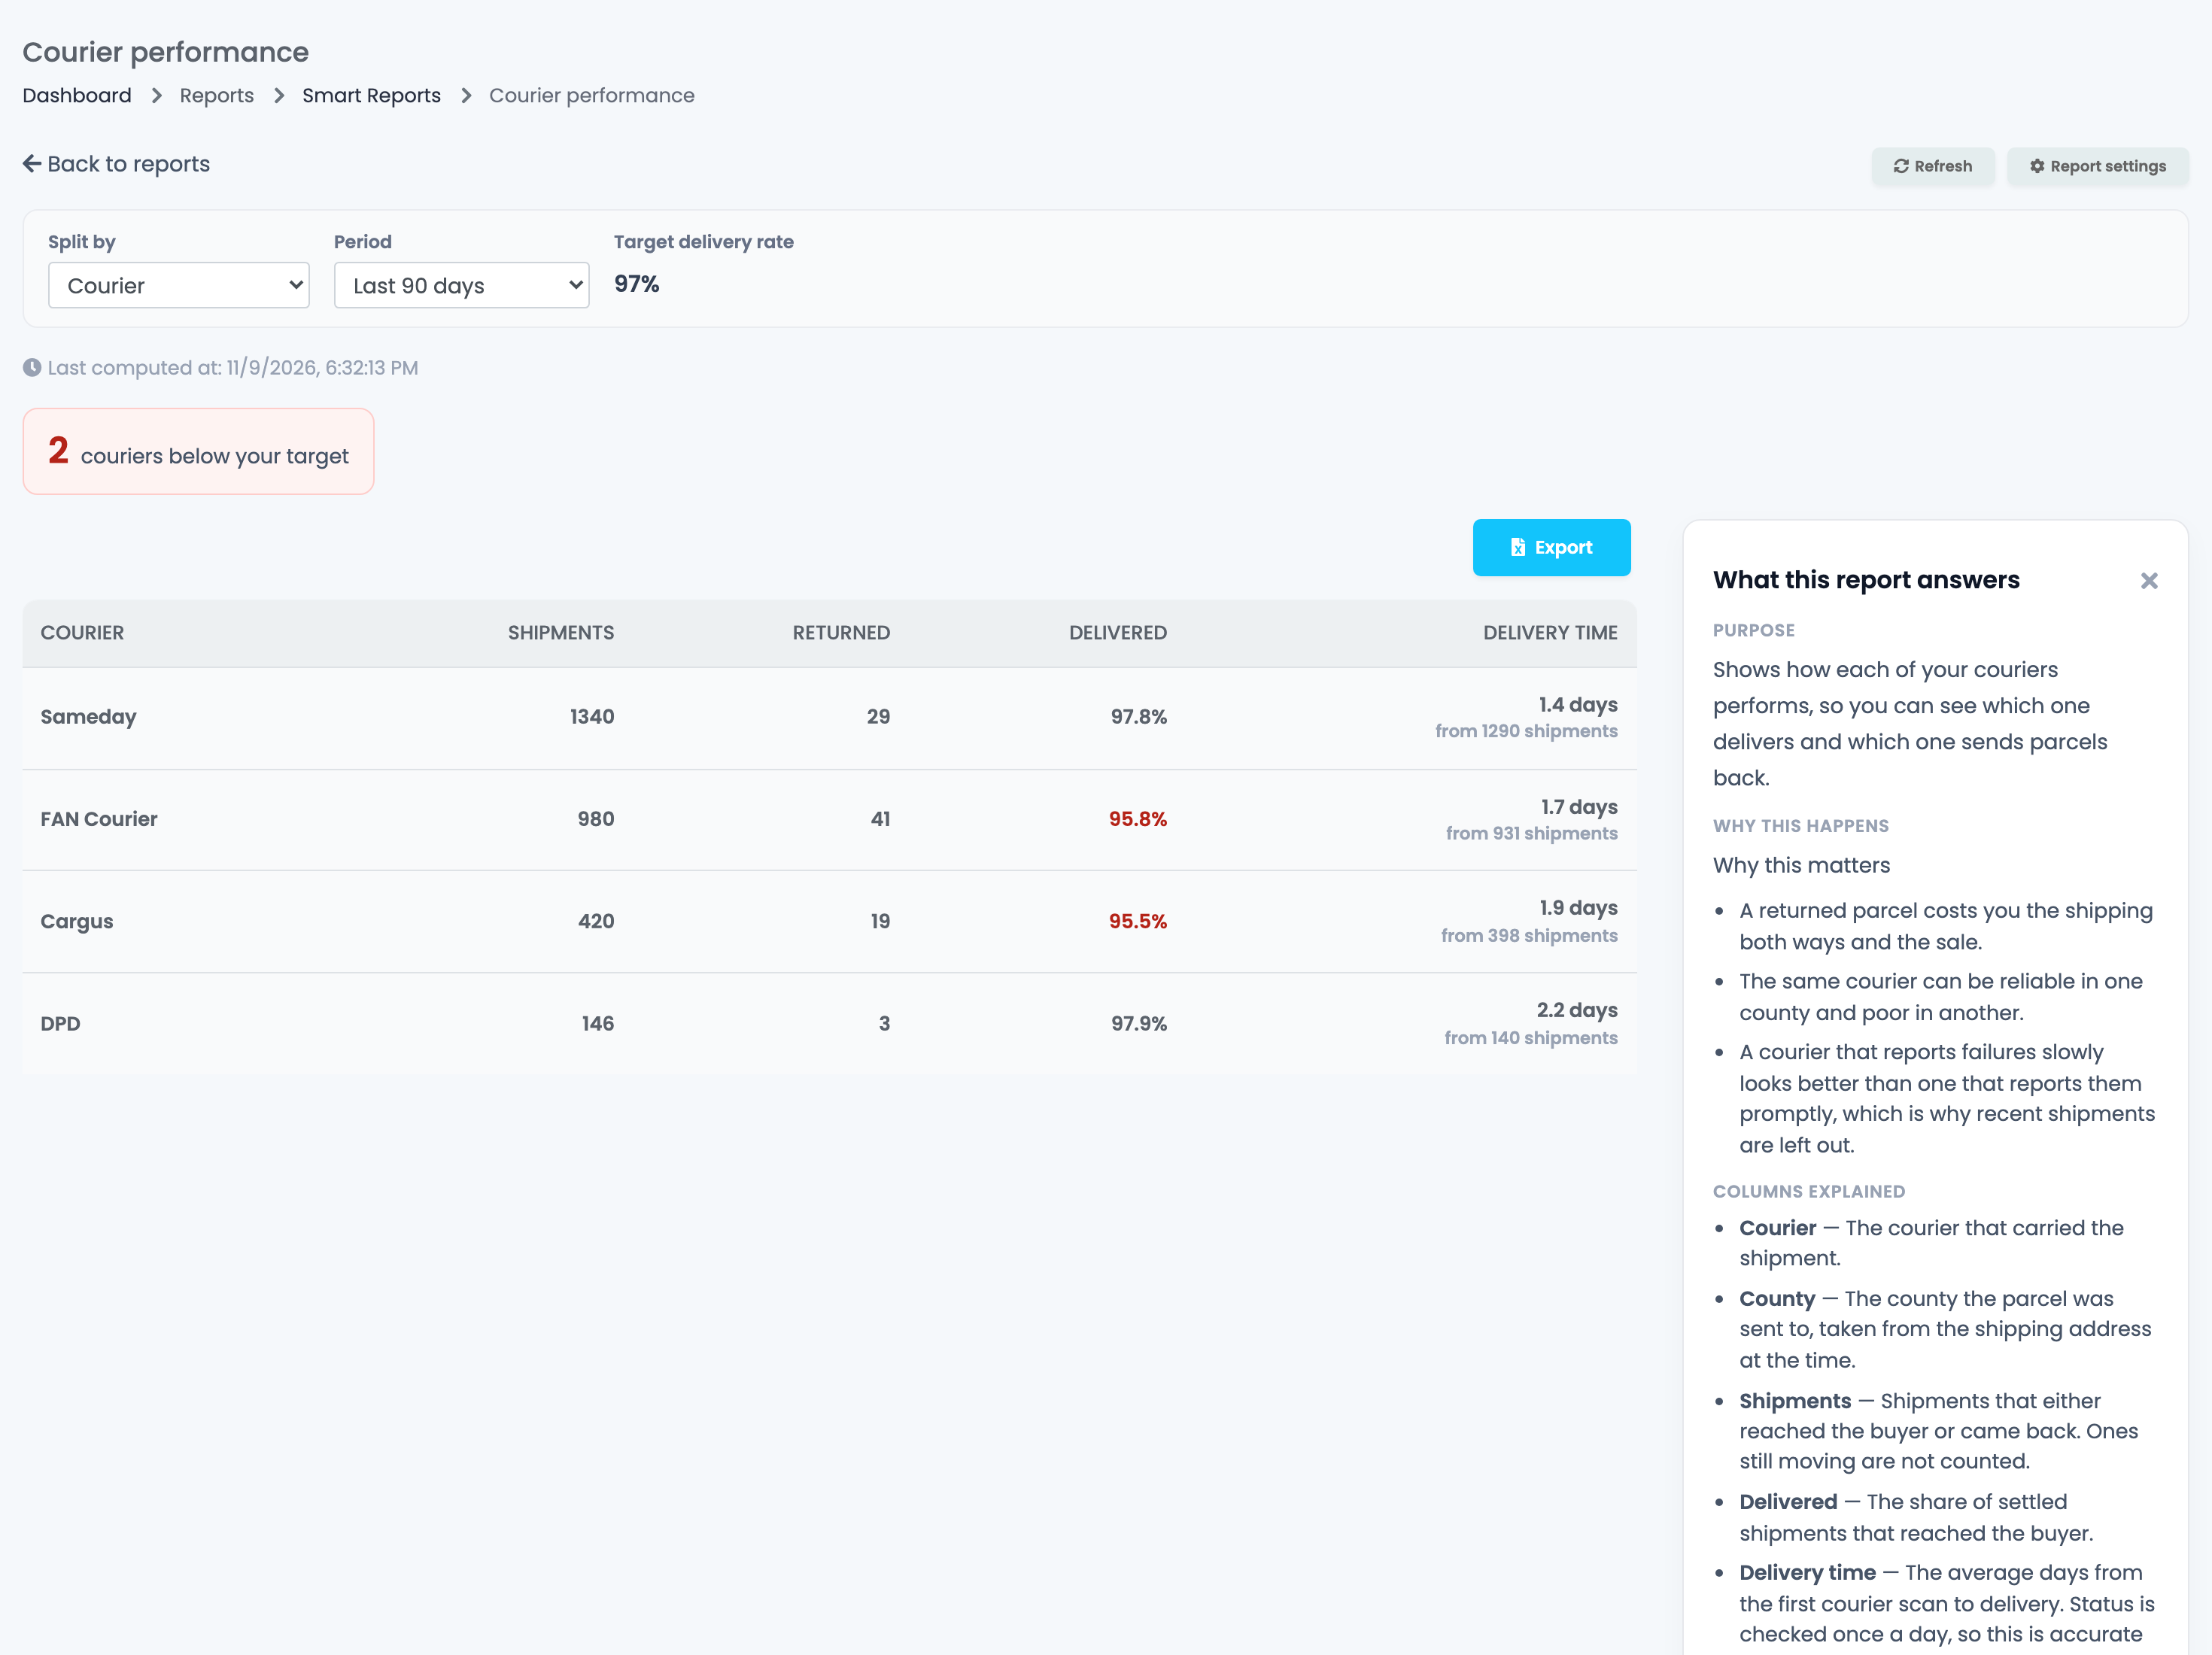
For each courier, the report shows the shipments that reached the buyer or came back, the share delivered, and the average delivery time, split by Courier or Courier and county. Shipments are counted by the date they were created, and the most recent days are left out, because their parcels are still on the way. A courier below your Target delivery rate is marked in red.
EU OSS threshold
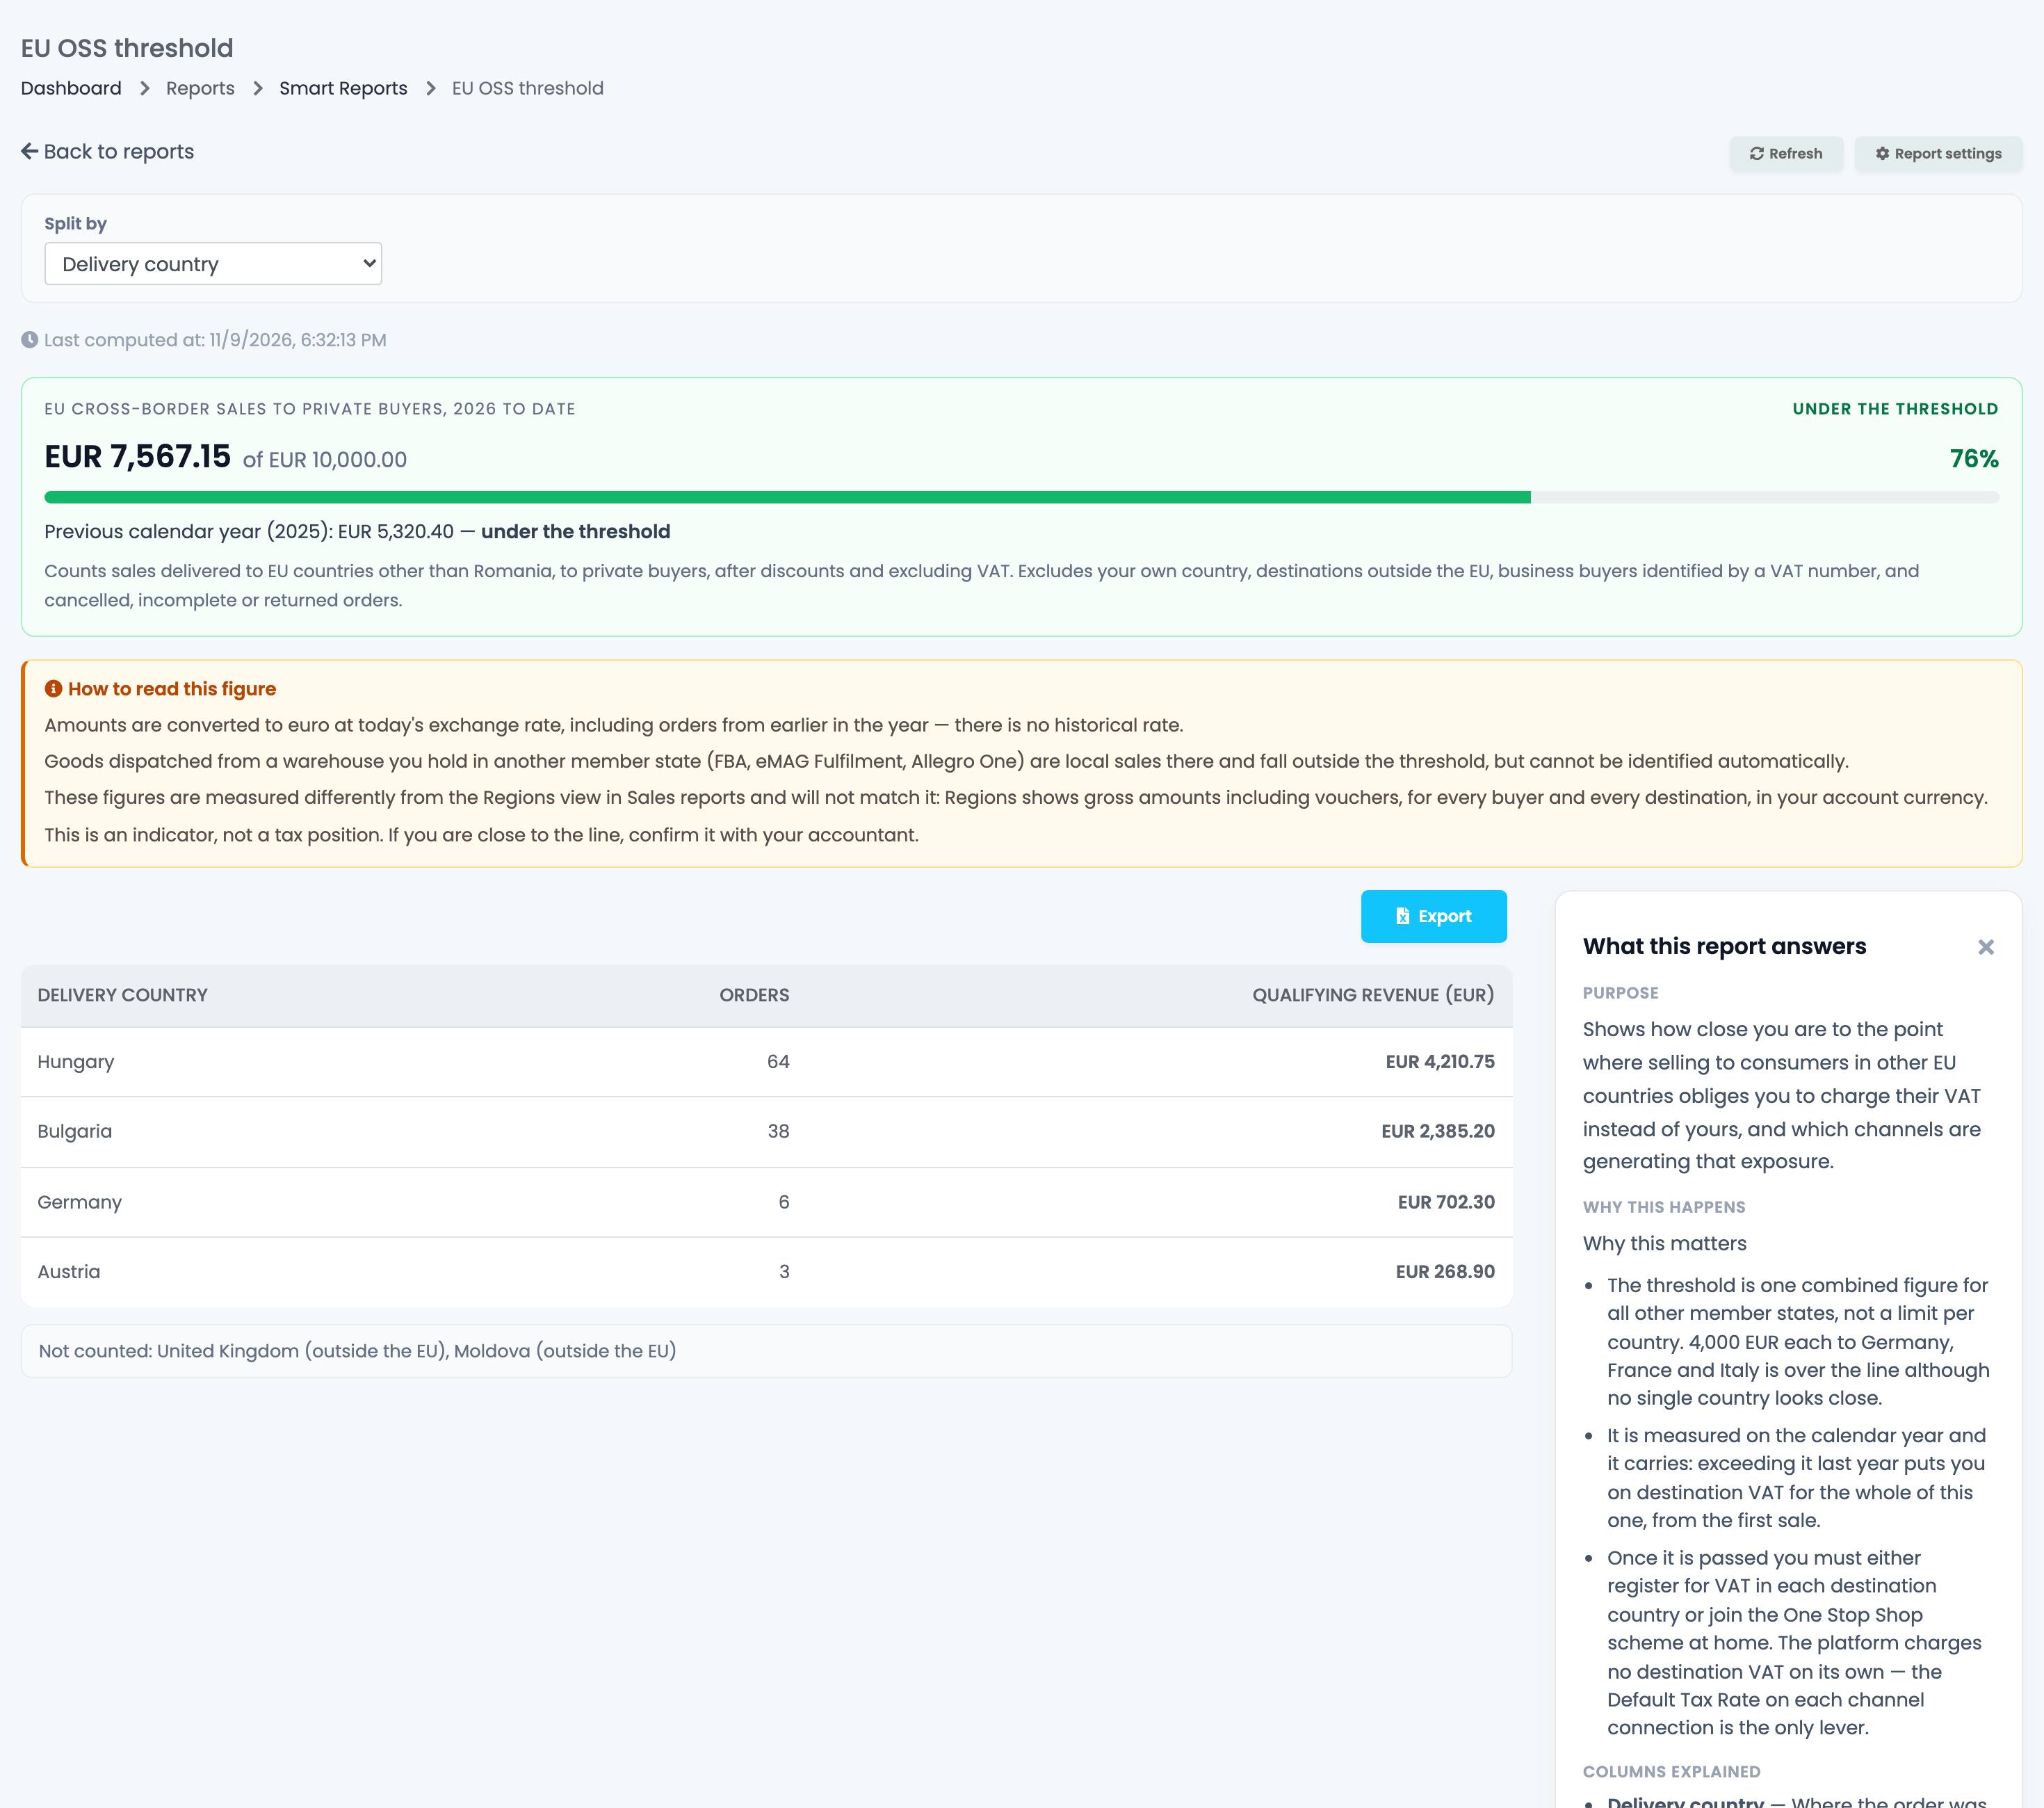
The report adds up this calendar year's sales to private buyers in other EU countries, to show how close you are to the EU threshold for distance sales.
- It counts orders with the status New, Received, Completed or Processing, after discounts and without VAT.
- Amounts in other currencies are converted to euro at today's rate.
- Goods shipped from a warehouse in another country, such as a marketplace fulfilment warehouse, cannot be told apart and are counted too.
eMAG offers and price addition
- Which active eMAG offers can still take orders you can't fulfil? lists active eMAG offers where eMAG still shows stock but easySales has none available. Resend sends the easySales stock to eMAG for one offer, Resend all for every offer in the list. The list is updated when the report is computed again.
- Which categories have the lowest price addition? shows the average price addition set on your offers in each category of a marketplace. It is the price addition from your offer settings, not your profit margin.
When something does not look right
| Symptom | What to do |
|---|---|
| The figures do not match my sales report | Each report counts its own orders, for example only completed orders for reordering. Read What this report answers on the report. |
| A product is missing from the reorder report | It has no completed order yet. Tick Include never-sold products in Report settings to show it. |
| The figures look old | The report shows the last snapshot. Press Refresh to compute it again. |
| The reorder quantities are too high or too low | Check the Lead time of the product, and the Forecast horizon (days) and Safety buffer (days) in Report settings. |
| An eMAG offer stays in the list after Resend | The list changes when the report is computed again. Press Refresh after the stock was sent. |
| A team member cannot open Smart Reports | Give them the View smart reports permission. |