How to read your easySales dashboard: tiles, charts and the setup helper

Understand the dashboard's totals, the monthly comparison, the orders and sales charts and the setup helper for new accounts.
What the dashboard shows
The dashboard is the first page you see after you sign in. It shows how your account looks today: how many orders, shops, products and offers you have, how this month compares with the last one, and your orders and sales over the last days.
To come back to it from anywhere, click the easySales logo at the top left.
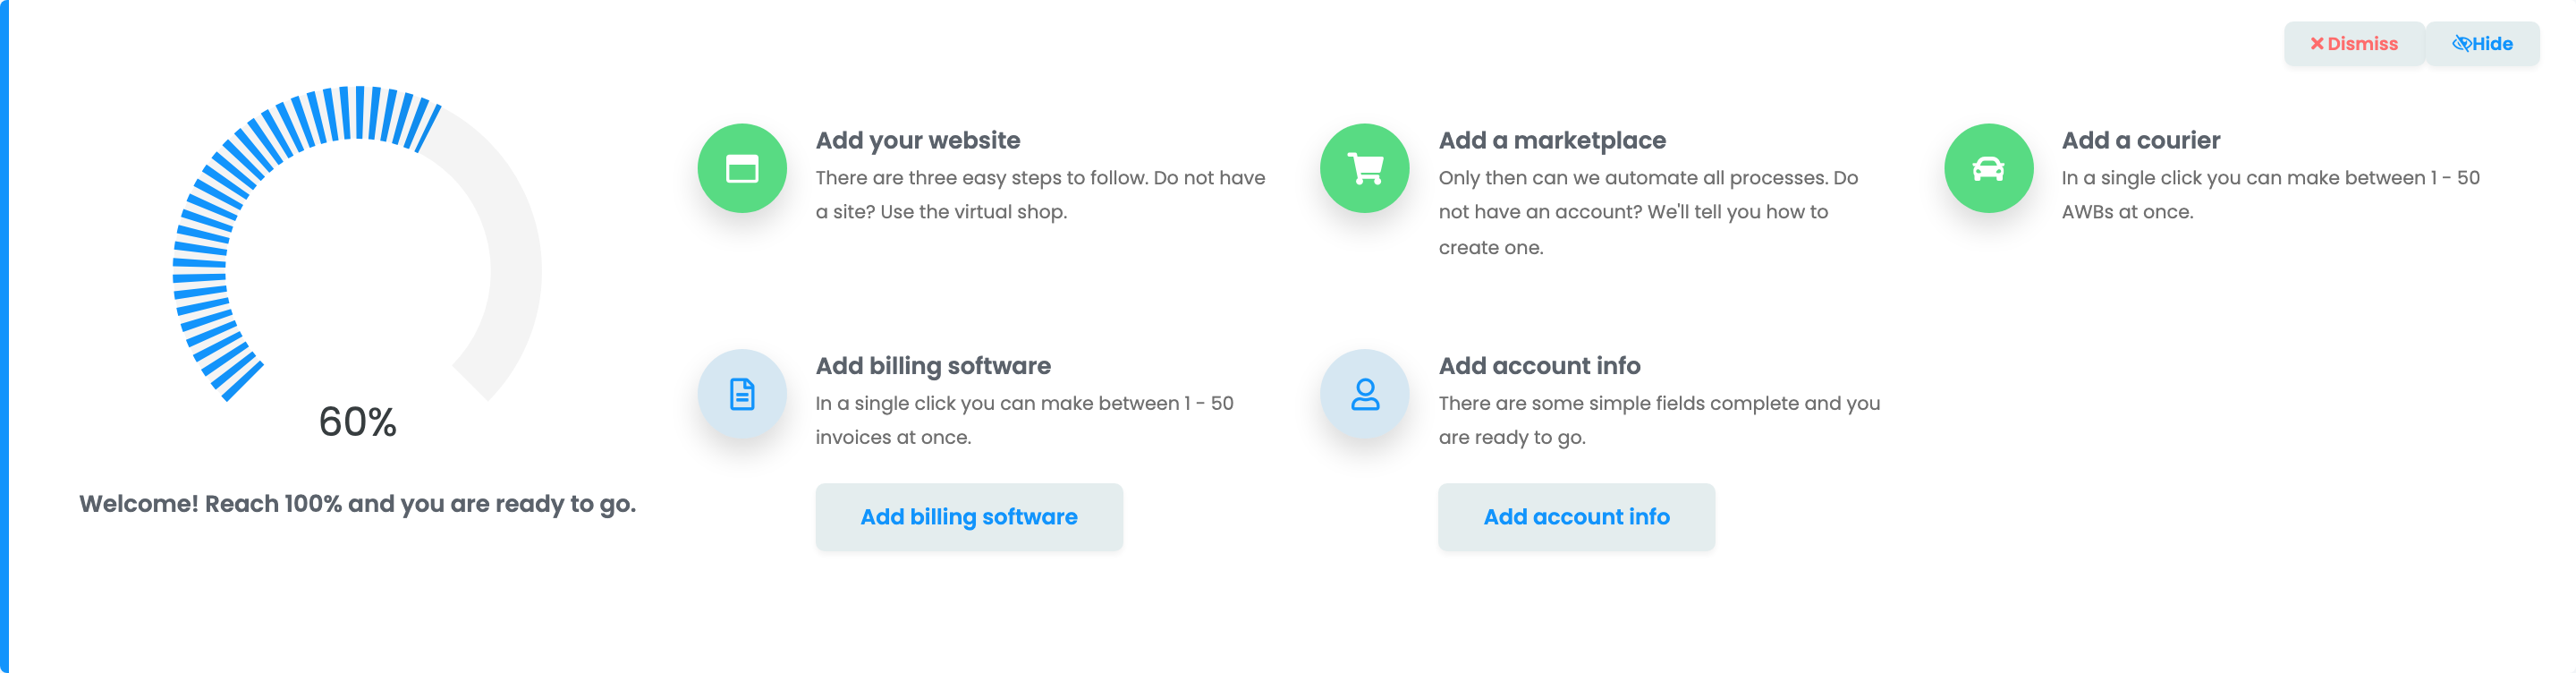
Setting up your account
A new account sees a setup helper at the top of the dashboard. It lists what to do so that easySales can work for you, in three steps, and ticks each task as you complete it.
| Step | Tasks |
|---|---|
| 1 | Add your website, Add a marketplace, Add a courier, Add billing software and Add account info. |
| 2 | Link Products to your marketplace offers, Associate Offers, Decouple Offers and turn on Auto Price. |
| 3 | Issue Invoices and AWBs and work with Process Groups. |
- Each task has a button that opens the page where you do it.
- At 100%, press Next Step to move to the next step.
- Hide folds the helper and Show opens it again, on this browser.
- Dismiss removes the helper for good, for you and your whole team. You cannot bring it back, so dismiss it only when you no longer need it.
Your account in numbers
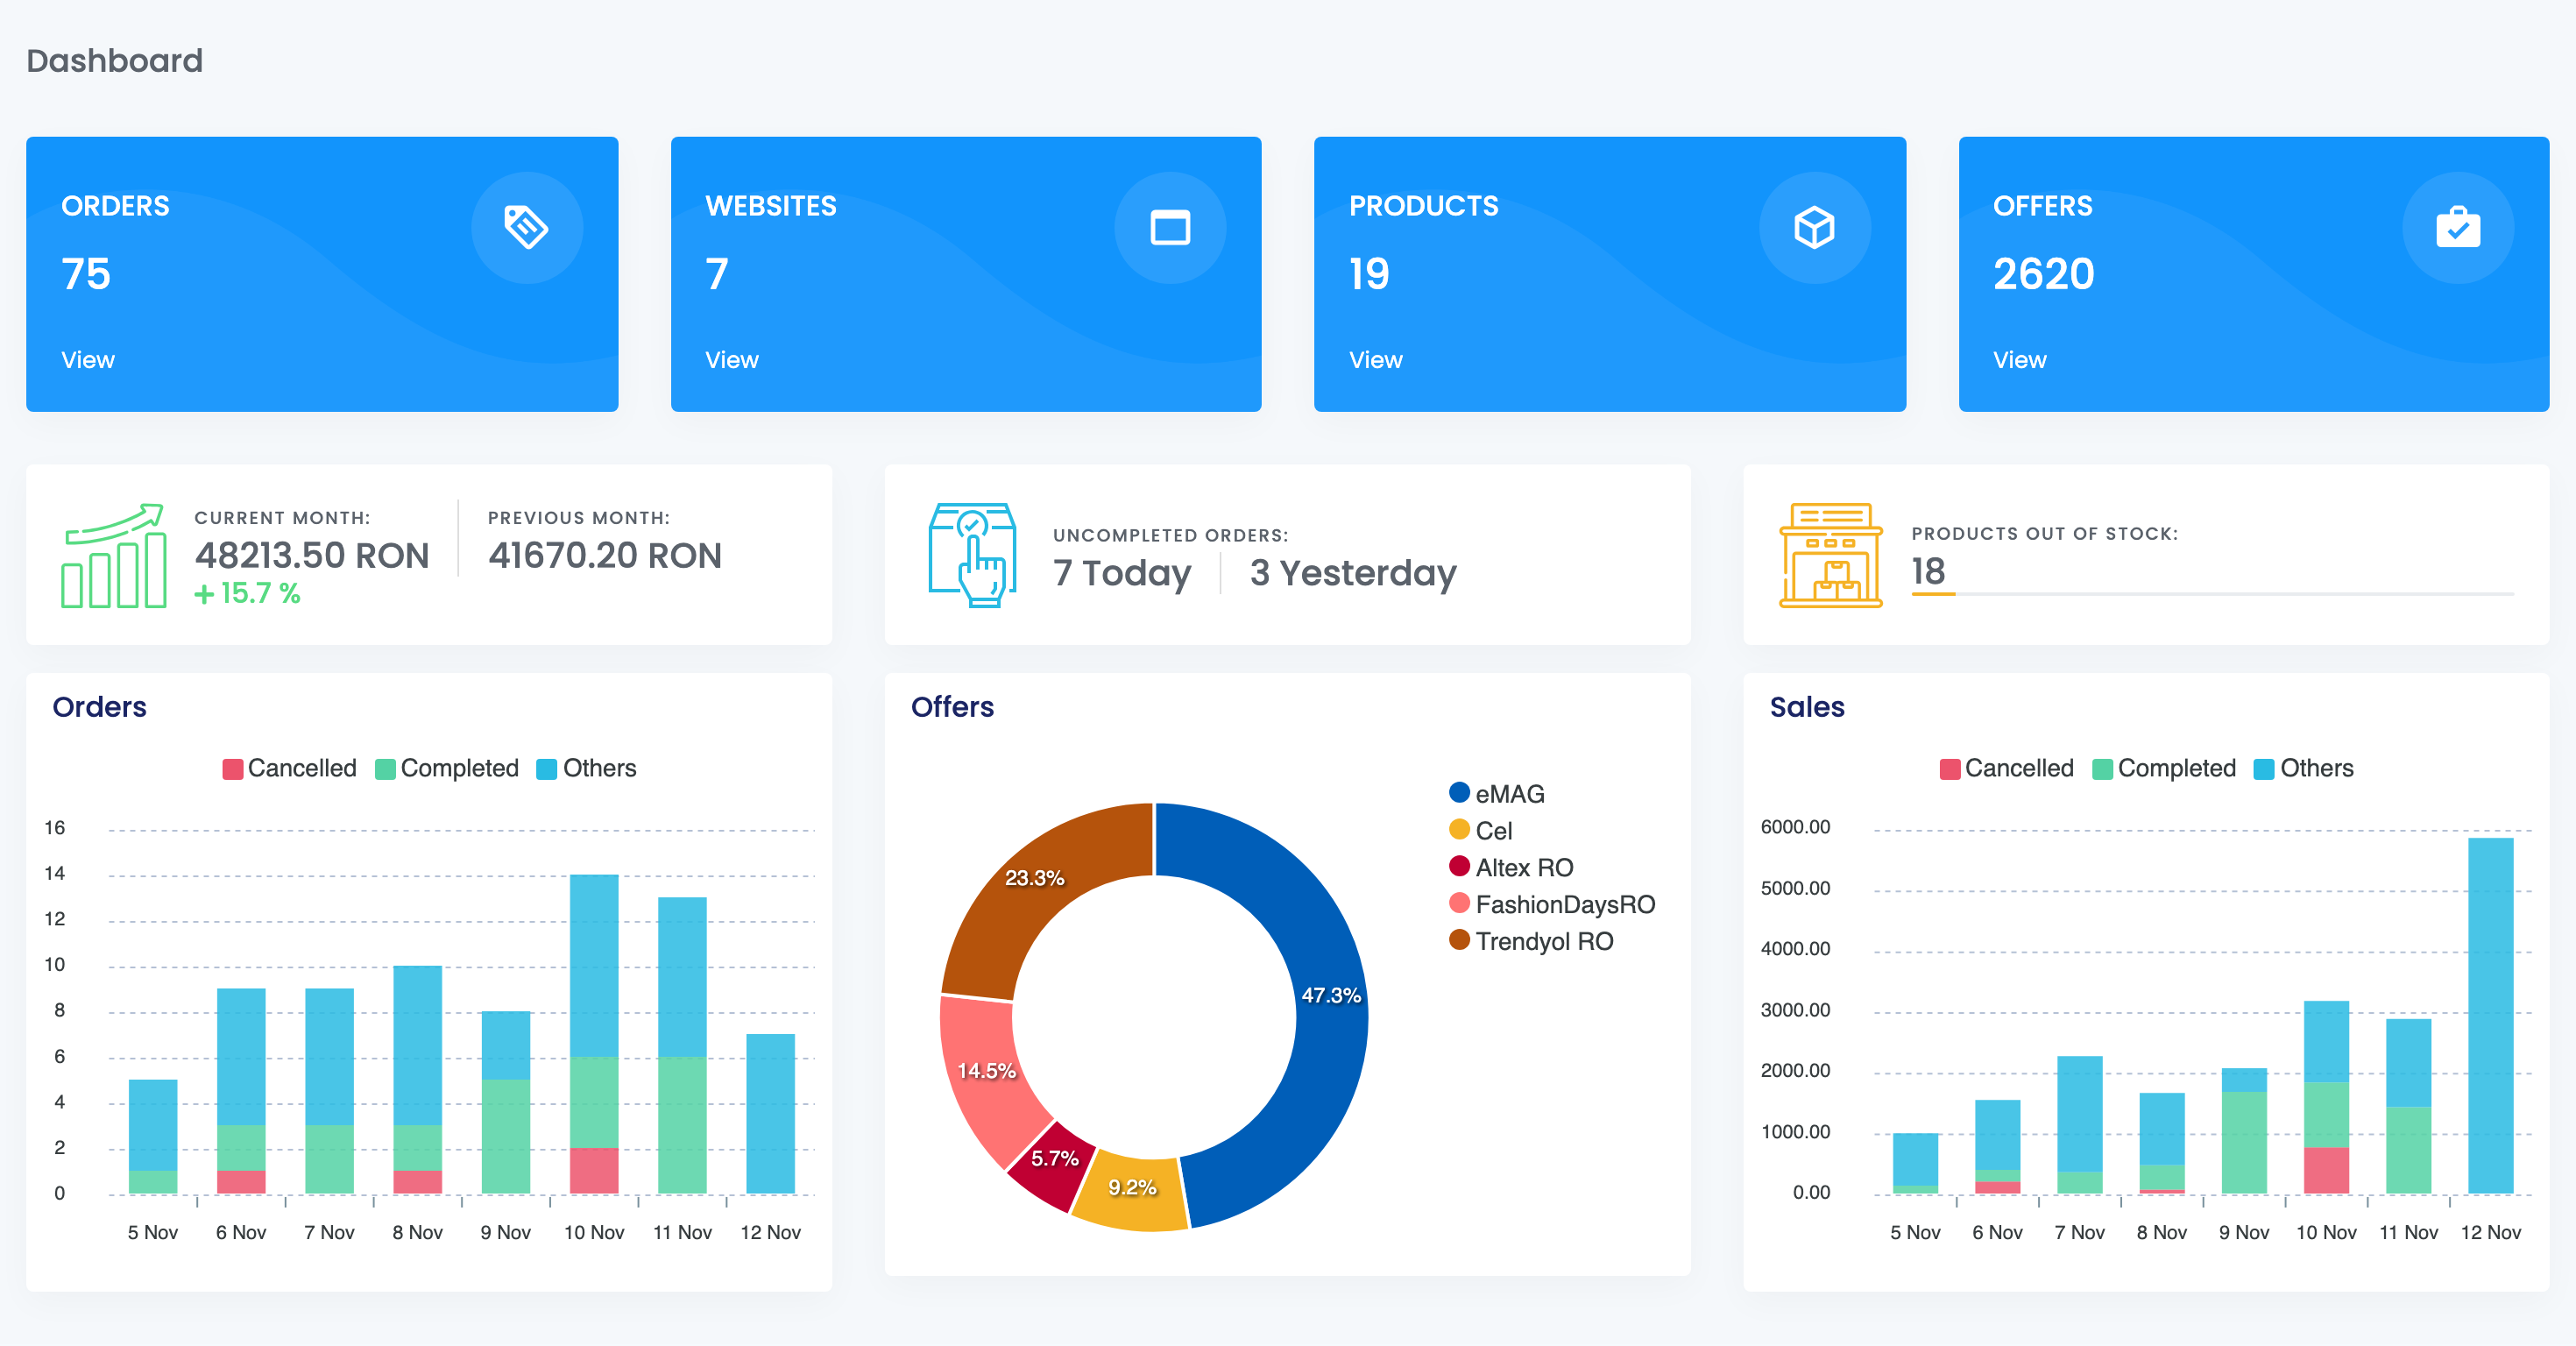
The four tiles at the top count everything you have, from the start of your account, not only this month:
- Orders: every order, in any status.
- Websites: your online shops, including the Virtual Shop.
- Products: the products of all your shops, including the Virtual Shop.
- Offers: your offers on all marketplaces, active or not.
View under each tile opens that list.
This month, today and stock
The row under the tiles answers three quick questions.
| Box | What it shows |
|---|---|
| Current Month / Previous Month | The value of your orders from the first of this month until now, next to the same days of last month, with the change in percent. No Data... means one of the two periods has no orders yet. |
| Uncompleted Orders | The orders placed Today and Yesterday that are not completed or cancelled yet. |
| Products out of stock | How many of your products have a stock of zero, and their share of all products. |
The charts
Three charts show the last eight days: today and the seven days before.
- Orders: how many orders came in each day.
- Sales: the value of those orders each day.
- Offers: how your offers are spread across marketplaces.
The orders and sales bars are split into Completed, Cancelled and Others, the orders still being processed. Click a bar to open the Orders list for that day.
The days follow your account's time zone. Sales are shown in the currency chosen in the top bar, so you can switch between currencies.
Your team
A team member sees the dashboard only with the View dashboard permission. Without it, they see a short message instead of the dashboard and use the menu to go on.
When something does not look right
| Symptom | What to do |
|---|---|
| I cannot find the dashboard in the menu | Click the easySales logo at the top left. |
| The monthly box shows No Data... | This month or the same days of last month have no orders yet, for example in your first month. |
| The monthly total is higher than my sales | Cancelled and returned orders are counted too. Use the sales reports for completed sales. |
| An order from three days ago is not in Uncompleted Orders | The box counts only orders placed today and yesterday. Use the Orders list for older ones. |
| The Offers tile counts offers I do not sell | It counts every offer, also inactive ones. |
| The setup helper is gone | It was dismissed on your account. It cannot be shown again. |